1) Calculations of forces in the truss members using the Method of Joints.
 |
| Truss Bridge That was used in Method of Joints |
 |
| This image shows the calculations that were made to determine the forces on each member, these formulas were derived by hand when solving the truss and were imputed into Excel so that hand calculations are not necessary as the bridge constraints change. |
2) Results of the Analysis above
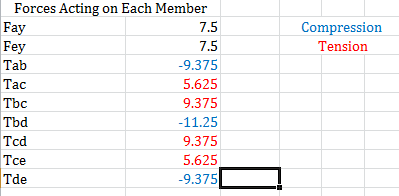
As you can see above members symmetrical to one another have the tension or compression force acting upon them
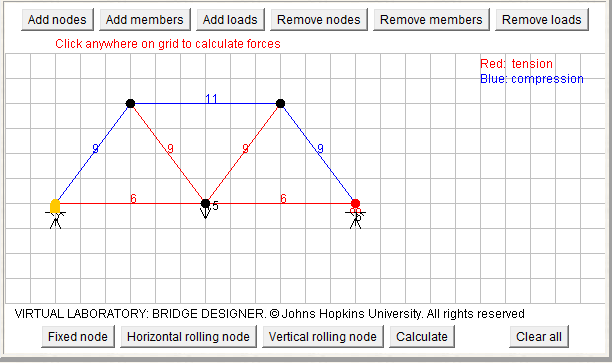
4) In order for the hand analysis to correspond to the analysis compiled by Bridge Designer one must scale their bridge so that the forces correspond with the values calculated by Bridge Designer. In the drawing above, each block represents 2" in length, and the nodes correspond to the connecters on the hand drawn bridge so the bridge in the image corresponds to the bridge that the analysis was preformed on, not surprisingly the results of the two analysis's are similar.
5)
 The forces in the knex bridge should be similar to the forces in the bridge designer analysis. The member lengths are similar therefor the forces felt should the similar for the center two sections. the forces shown in the diagram for the sections on the outer sides of the diagram are showing non-realistic forces. The bridge design above while not a full bridge, provides a glimpse at the final product, a bridge constructed using the same sections as shown above held 49.4 lbs, this analysis is showing forces in that are far beyond the tolerances of knex with a smaller load. Also the load that I used for the knex bridge was 15 lbs, when creating an analysis multiple times I was shown a picture that did not seem right, tension and compression of zero on one section and on the symmetrical section the forces are to strong to be possible.
 6) Using the method of joints analysis one is able to determine a number for the tension and the compression of members of the bridge for a given load. When viewing the information about the strength of knex connectors one is able to use the analysis to determine under what load the bridge is expect to fail and at which connector. Looking at the tensile pull out force chart it is clear that connectors with three members attached to them have the highest pull out force (avg 35.6lbs). Connectors with two members attached to them have an average pull out force of 26.5 lbs this is almost a 10 pound decrease in strength from the connectors with three members attached to them. Lastly the weakest connections are the ones that only contain one member; these have an average pull out strength of 20.7 lbs. Using this information the goal of the bridge design is to maximize the number of connectors that have three members attached while reducing the number of connectors with only one member attached. Using the analysis provides the number of pounds of force a given member has acting on it and paired with the information from the table it should now be possible to determine what members in bridge are adding cost and no structural advantage.
No comments:
Post a Comment